Executive summary
- There is significant lag in reporting diagnosis date of COVID-19 cases in New York City by days, sometimes weeks or much further back (mostly in the beginning)
- Case counts by diagnosis date follow a weekly pattern, likely mirroring testing availability
—
When COVID-19 first came to America, I would monitor the New York City case count daily to help me make a short-term decision as to how frequently I should be going out. I also tracked the numbers to predict when it would likely taper down so that I can prepare myself psychologically to be physically isolated for an extended period of time. New York City does a good job of making the data accessible and I wanted to know retrospectively whether my decisions of going out of my home were good.
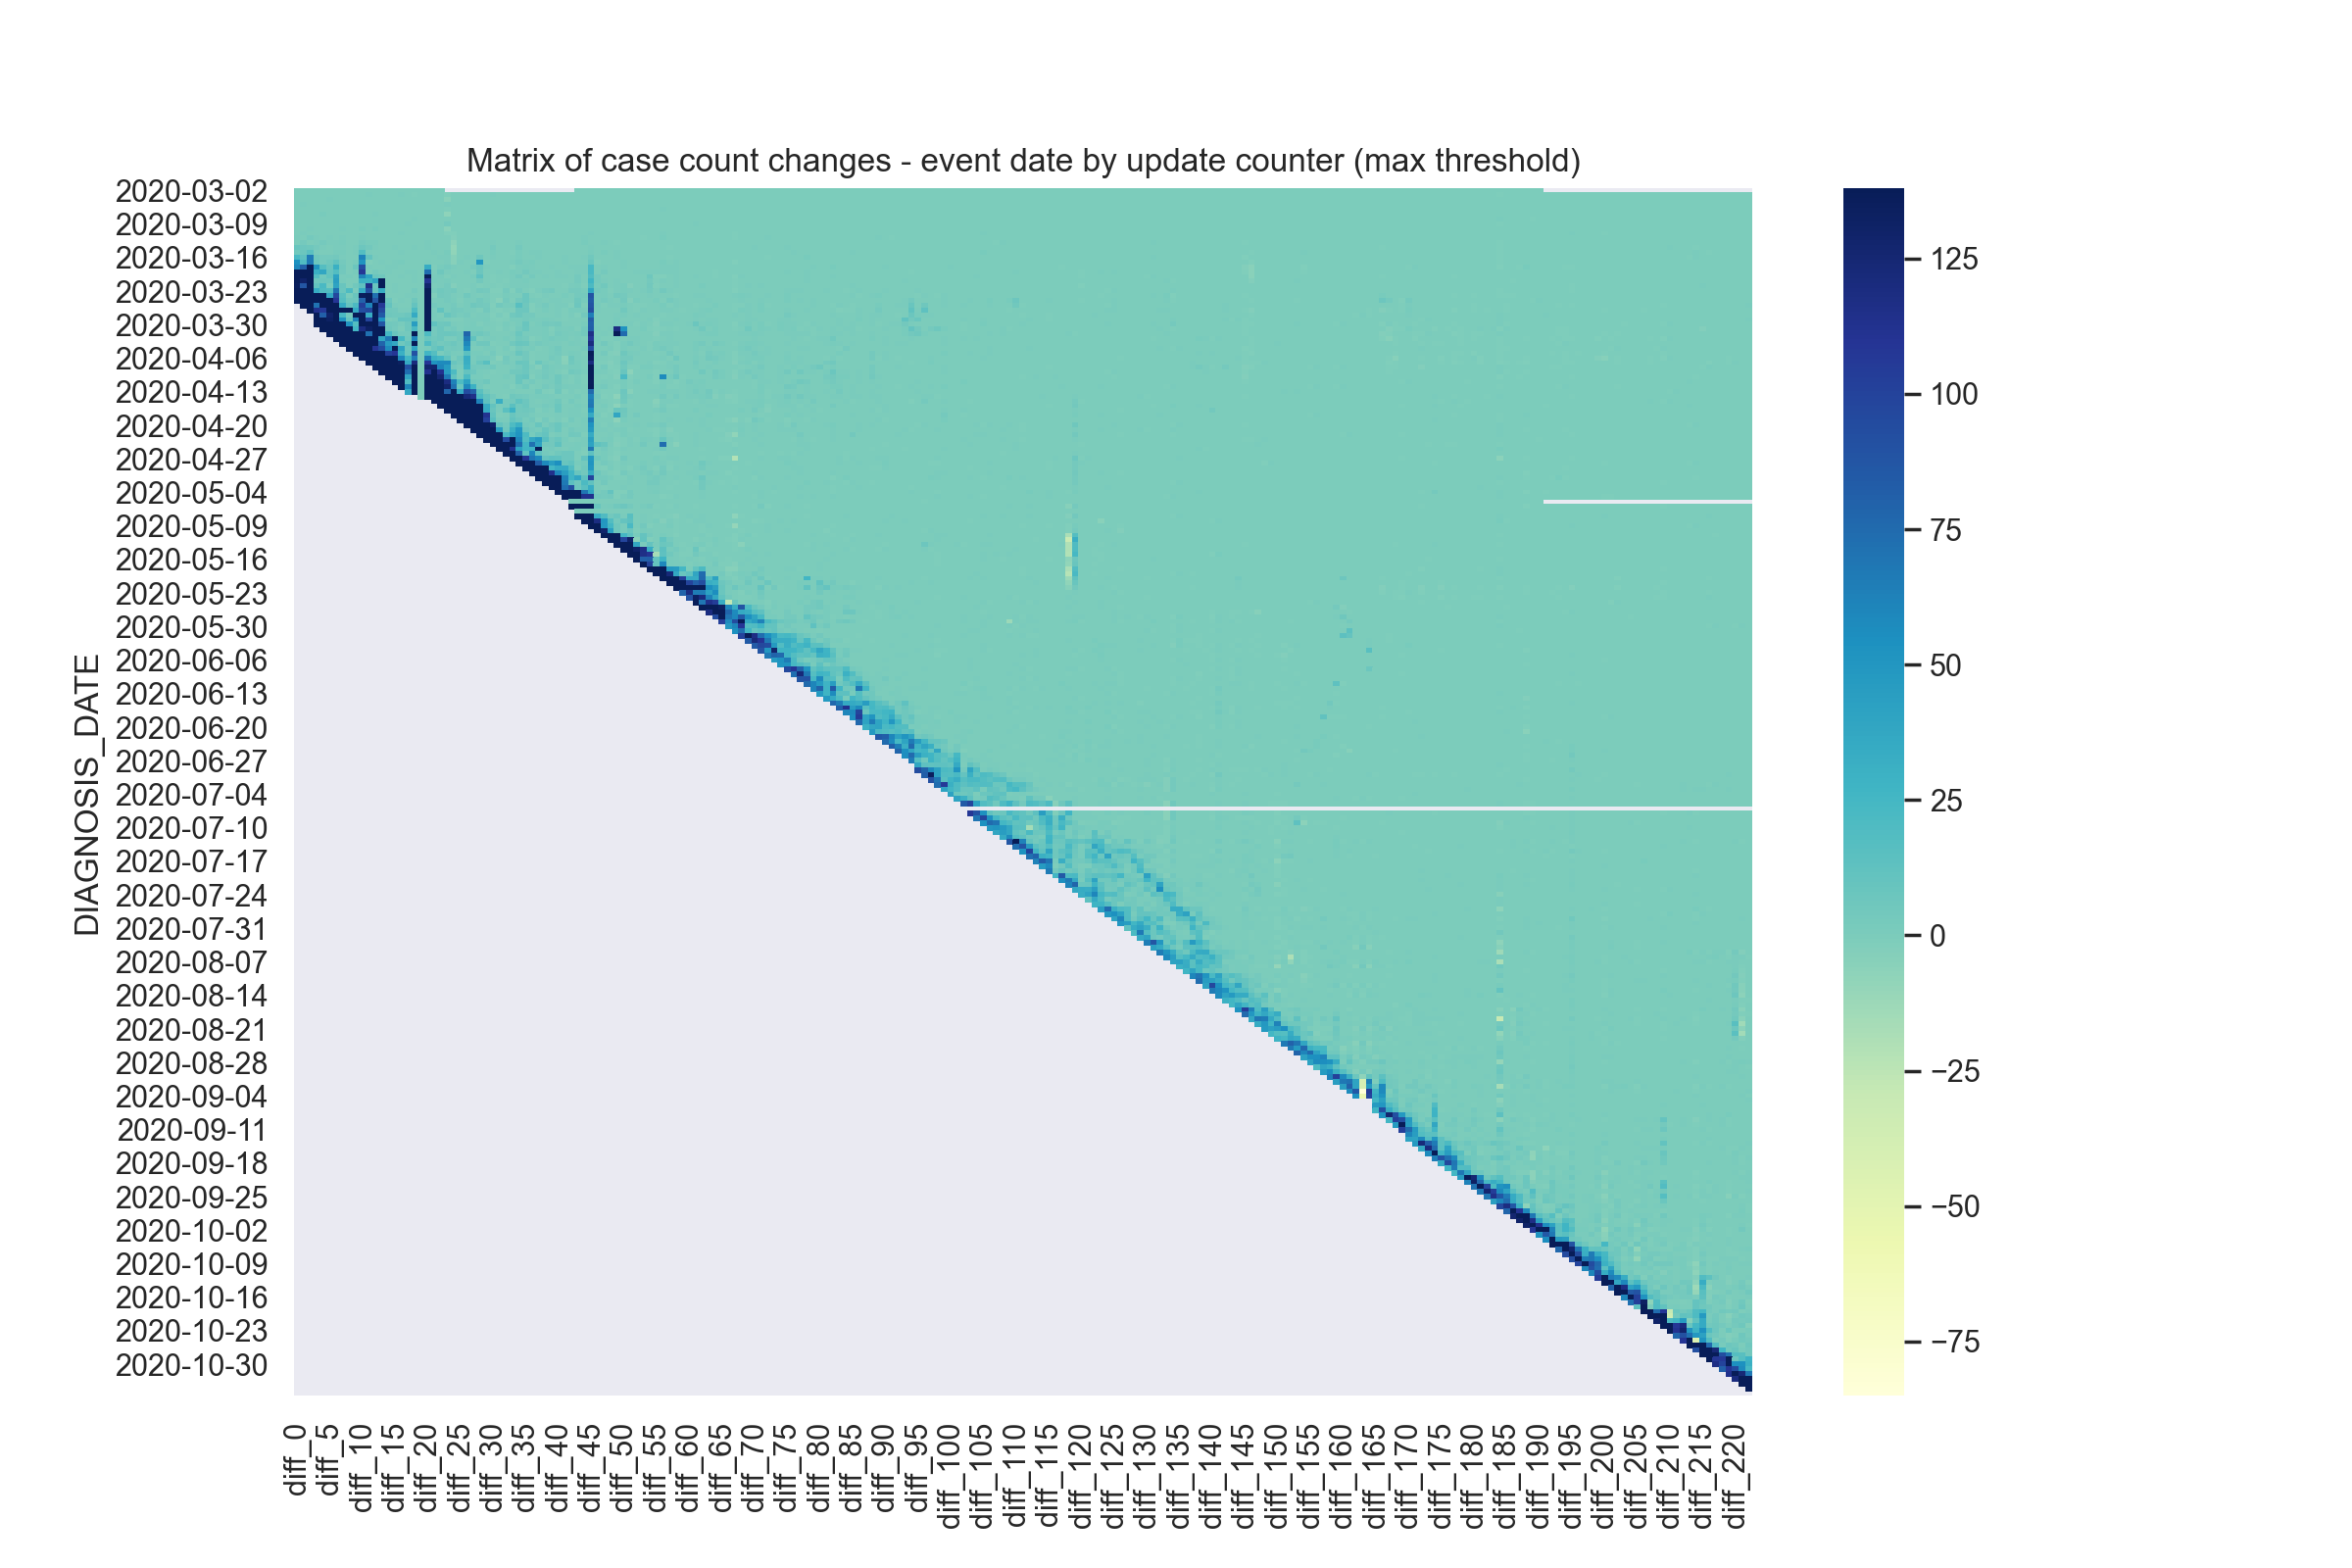
I extracted data from their github repository and downloaded all prior data versions. They changed their folder and data schema a few times, so for this first analysis, I took the easiest route and got around the first six months of data. I did a simple analysis of only the case count and thought about the data in three ways. The first is a matrix showing the case count change after each update by event date. The other two are the cumulative case count changes by event date and update iteration, respectively. So how skewed are the numbers from what they actually tallied up towards? And going into the fall, was the tallying closer to what the numbers actually ended up as?
In the first few months (March to May), there were significant retrospective updates across earlier diagnosis dates, sometimes with the addition of over two thousand cases. During May, there was one massive retrospective update that backdated cases all the way to March. As we approached the summer, the additional retrospective case counts continued to occur up to around a week but at a significantly lower magnitude. Approaching the fall in September and October, there was a continued lag but it spanned a shorter backdate range than previously. However, as cases started increasing again, the number of cases being backdated was higher than the summer.
If we look at the case count by event date, we will notice the weekly pattern that possibly follows the availability of testing.

That pattern does becomes less clear when we look by update counter (updates generally occur daily).

You can access the code repository with the extracted data.
